LLM for Data Visualization: How AI Shapes the Future of Analytics

A few weeks back, I wrote an article about How to Build an AI Agent for Data Analytics Without Writing SQL. The blog demonstrates the capabilities of LLM and AI agents. It is remarkable to observe that LLM comprehends the inquiry with such precision, and with the supplementary schema it has been provided with, it is capable of composing an executable SQL statement that produces the appropriate outcome. Can expand to LLM for Data Visualization?

In numerous instances, data analytics extends beyond textual summaries of findings; particularly in Exploratory Data Analysis (EDA), data visualisation is essential. I will broaden the scope of the AI Agenet’s capabilities in this blog post. In addition to its ability to generate SQL, I will improve its ability to generate data visualisation code in seaborn and plotly and return the chart as the final output.

Tools & Data Used Today

Extend High-Level Workflow with Data Visualization

AI Agent for Data Visulization Workflow | Image by Author

We will add two new nodes in our LangGraph from our previous diagram mentioned in How to Build an AI Agent for Data Analytics Without Writing SQL: write_code_for_chart and execute_python code.

  1. write_code_for_chart: this function is the core for producing executable Python code utilising Seaborn for visualisation. The fundamental concept is to supply sufficient information from the upstream results, such as the SQL statement and output, to the LLM model, enabling it to generate code for chart construction.
  2. execute_python: this function basically takes the string from write_code_for_chart step and executes the Python code. 
Our Pick
Building Agentic AI Systems: Create intelligent, autonomous AI agents that can reason, plan, and adapt
$41.24

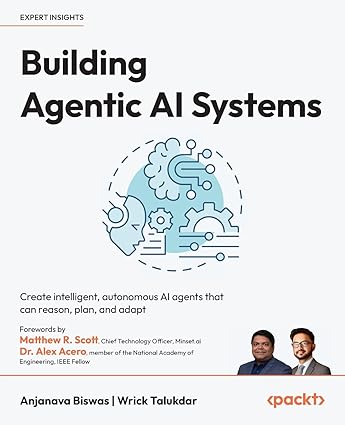
Master the art of building AI agents with large language models using the coordinator, worker, and delegator approach for orchestrating complex AI systems

Key Features

  • Understand the foundations and advanced techniques of building intelligent, autonomous AI agents
  • Learn advanced techniques for reflection, introspection, tool use, planning, and collaboration in agentic systems
  • Explore crucial aspects of trust, safety, and ethics in AI agent development and applications
  • Purchase of the print or Kindle book includes a free PDF eBook


Buy Now
We earn a commission if you make a purchase, at no additional cost to you.
01/12/2026 06:00 am GMT

Step 4. write_code_for_chart

We would need to provide LLM with an adequate amount of information in order to enable them to write code for you. Prompt engineering is beyond the scope of our discussion; however, we essentially supply additional content to the LLM to ensure accurate task completion. 

Here, we can keep a simple graph, such as a bar chart, and add more detail to fine-tune how the chart should look.

Another crucial aspect for execution is to minimise non-executable responses from the LLM, such as “Here is the Python code for accomplishing XYZ.” We can instruct our LLM with additional input, such as return executable code only . This method is more efficient, eliminating the need for specialised data processing to extract executable code from the response. 

				
					def write_code_for_chart(state: State):
        """Generate Python Code for Data Visualization """
        prompt = (
            "Given the following user question, corresponding SQL query, "
            "and SQL result, build a python Seaborn script to with bar chart to show the data, return executable code only\n\n"
            f'Question: {state["question"]}\n'
            f'SQL Query: {state["query"]}\n'
            f'SQL Result: {state["result"]}'
        )
        response = llm.invoke(prompt)
        return {"code": response.content}


Step 5. execute_python

At this stage, we should have the LLM-generated code for us to execute. We still need to perform some data processing to replace specific words and symbols. Afterward, we can utilise Python’s exec function, which enables the dynamic execution of Python code.

				
					def execute_python_code(state: State):
        code = state["code"]
        code = code.replace("python", "")
        code = code.replace("```", "")
        exec(code)


Put All Together

Now we can try some examples to see what it looks like in the end. Before we do that, we’d need to add those two new functions into our LangGraph:

				
					from langgraph.graph import START, StateGraph

graph_builder = StateGraph(State).add_sequence(
    [write_query, execute_query, generate_answer, write_code_for_chart, execute_python_code]
)

graph_builder.add_edge(START, "write_query")
graph = graph_builder.compile()


Then we can ask questions about the data and have the LLM run queries against DuckDB. Once the data has been retrieved, we can ask the LLM to write some executable code so that we can build the chart we want. 

Here is the question we can ask our AI agent: 

This is a dataset about New York Airbnb, can you provide average price for each neighbourhood and rank them in descending order?

Then we got those from our graph

				
					{'write_query': {'query': "SELECT neighbourhood, AVG(price) AS average_price \nFROM read_csv_auto('data/AB_NYC_2019.csv')\nGROUP BY neighbourhood\nORDER BY average_price DESC\nLIMIT 10;"}}
{'execute_query': {'result': [Document(metadata={}, page_content='neighbourhood: Fort Wadsworth\naverage_price: 800.0'), Document(metadata={}, page_content='neighbourhood: Woodrow\naverage_price: 700.0'), Document(metadata={}, page_content='neighbourhood: Tribeca\naverage_price: 490.638418079096'), Document(metadata={}, page_content='neighbourhood: Sea Gate\naverage_price: 487.85714285714283'), Document(metadata={}, page_content='neighbourhood: Riverdale\naverage_price: 442.09090909090907'), Document(metadata={}, page_content="neighbourhood: Prince's Bay\naverage_price: 409.5"), Document(metadata={}, page_content='neighbourhood: Battery Park City\naverage_price: 367.5571428571429'), Document(metadata={}, page_content='neighbourhood: Flatiron District\naverage_price: 341.925'), Document(metadata={}, page_content='neighbourhood: Randall Manor\naverage_price: 336.0'), Document(metadata={}, page_content='neighbourhood: NoHo\naverage_price: 295.71794871794873')]}}
{'generate_answer': {'answer': "The average price for each neighbourhood, ranked in descending order, is as follows:\n\n1. Fort Wadsworth: $800.00\n2. Woodrow: $700.00\n3. Tribeca: $490.64\n4. Sea Gate: $487.86\n5. Riverdale: $442.09\n6. Prince's Bay: $409.50\n7. Battery Park City: $367.56\n8. Flatiron District: $341.93\n9. Randall Manor: $336.00\n10. NoHo: $295.72"}}
{'write_code_for_chart': {'code': '```python\nimport pandas as pd\nimport seaborn as sns\nimport matplotlib.pyplot as plt\n\n# Data from the SQL result\ndata = {\n    \'neighbourhood\': [\n        \'Fort Wadsworth\', \'Woodrow\', \'Tribeca\', \'Sea Gate\', \'Riverdale\',\n        "Prince\'s Bay", \'Battery Park City\', \'Flatiron District\', \'Randall Manor\', \'NoHo\'\n    ],\n    \'average_price\': [\n        800.0, 700.0, 490.638418079096, 487.85714285714283, 442.09090909090907,\n        409.5, 367.5571428571429, 341.925, 336.0, 295.71794871794873\n    ]\n}\n\n# Create a DataFrame\ndf = pd.DataFrame(data)\n\n# Plot using Seaborn\nsns.set(style="whitegrid")\nplt.figure(figsize=(10, 6))\nsns.barplot(x=\'average_price\', y=\'neighbourhood\', data=df, palette=\'viridis\')\n\n# Add labels and title\nplt.xlabel(\'Average Price\')\nplt.ylabel(\'Neighbourhood\')\nplt.title(\'Top 10 Neighbourhoods by Average Airbnb Price in NYC\')\n\n# Show plot\nplt.show()\n```'}}


🎉 Here is the nice chart from the seaborn

Top 10 Neighbourhoods by Average Airbnb Price in NYC Bar Chart | Image by Author

The user is not required to write a single line of code to generate the chart above once the AI Agent is constructed, and the result is a visually appealing chart. 

Add Addtional Chart Type

Bar charts are exceedingly advantageous in numerous circumstances. However, we have hardcoded our function to always use a bar chart, which may not always be the desired outcome. 

We can request the LLM to generate the desired chart by specifying a chart type in our input for the LLM calls. As the initial input might go through multiple steps, we need to cache a chart type in the first place as input. We can accomplish this by InMemoryStore from langchain. 

We can wrap the chart_type as InMemoryStore and set a chart_type from the user’s input. 

				
					from langchain.storage import InMemoryStore

global store

def llm_chart(question: str, chart_type: str):
    store = InMemoryStore()
    store.mset([('chart_type', chart_type)])
    for step in graph.stream({"question": question}, stream_mode="updates"):
        print(step)
    store = InMemoryStore()


Then we can update the write_code_for_chart function to be

				
					def write_code_for_chart(state: State):
    chart_type = store.mget(['chart_type'])[0]

    prompt = (
        "Given the following user question, corresponding SQL query, "
        f"and SQL result, build a python Seaborn script to with {chart_type} chart to show the data, return executable code only\n\n"
......


Here is the output if we decide to use a pie chart

Top 10 Neighbourhoods by Average Airbnb Price in NYC Pie Chart | Image by Author
Our Pick
Storytelling with Data: A Data Visualization Guide for Business Professionals
$24.06

Don't simply show your data—tell a story with it! Storytelling with Data teaches you the fundamentals of data visualization and how to communicate effectively with data. You'll discover the power of storytelling and the way to make data a pivotal point in your story. The lessons in this illuminative text are grounded in theory, but made accessible through numerous real-world examplesready for immediate application to your next graph or presentation.

Storytelling is not an inherent skill, especially when it comes to data visualization, and the tools at our disposal don't make it any easier. This book demonstrates how to go beyond conventional tools to reach the root of your data, and how to use your data to create an engaging, informative, compelling story. Specifically, you'll learn how to:

  • Understand the importance of context and audience
  • Determine the appropriate type of graph for your situation
  • Recognize and eliminate the clutter clouding your information
  • Direct your audience's attention to the most important parts of your data
  • Think like a designer and utilize concepts of design in data visualization
  • Leverage the power of storytelling to help your message resonate with your audience

Together, the lessons in this book will help you turn your data into high impact visual stories that stick with your audience. Rid your world of ineffective graphs, one exploding 3D pie chart at a time. There is a story in your dataStorytelling with Data will give you the skills and power to tell it.

Buy Now
We earn a commission if you make a purchase, at no additional cost to you.
01/12/2026 05:01 pm GMT

Geographic Data Visualization with LLM

With a solid foundation in place, constructing a geographic data visualisation is a straightforward endeavour. Regrettably, seaborn lacks direct support for geographic maps, making the integration with other mapping visualisations somewhat complex; therefore, we will utilise plotly instead.

There are only two minor places we will change our code; the first is the write_code_for_chart. Instead of seaborn, we can replace it with plotly

				
					def write_code_for_chart(state: State):
.......
    prompt = (
        "Given the following user question, corresponding SQL query, "
        f"and SQL result, build a python plotly script to with {chart_type} chart to show the data, return executable code only\n\n"
......


Subsequently, for the chart_type in the final query, we can assign the value as map.

				
					question = "This is a dataset about New York Airbnb, can you show all the host by latitude and longitude"
chart_type = 'map'
llm_chart(question, chart_type)


🎉 We have the nice New York city map with some Airbnb host location mapped nicely

Airbnb Host Location Generated By LLM | Image By Author

Final Thought

We have seen the power of AI agents to build executed SQL queries and summarisation in How to Build an AI Agent for Data Analytics Without Writing SQL

This post explores how LLM facilitates data visualisation without requiring knowledge of libraries such as Seaborn or Plotly. We have seen the capability with LLM-generated code in multiple chart types without any issue. 

I am eager to observe how LLM can influence the future of data visualisation. What is your perspective? 

Complete code: https://github.com/ChengzhiZhao/AIAgentExamples/tree/main/ChartGeneration

disclaimer: this post has no affiliation or partnership with the companies/tools

Recommeded Books

Hands-On Large Language Models: Language Understanding and Generation

Driven by rapid advances in deep learning, language AI systems are able to write and understand text better than ever before. This trend is enabling new features, products, and entire industries. Through this book’s visually educational nature, readers will learn practical tools and concepts they need to use these capabilities today.

About Me

I hope my stories are helpful to you. 

For data engineering post, you can also subscribe to my new articles or becomes a referred Medium member that also gets full access to stories on Medium.

In case of questions/comments, do not hesitate to write in the comments of this story or reach me directly through Linkedin or Twitter.

More Articles

Photo by Karsten Würth on Unsplash

Here Is What I Learned Using Apache Airflow over 6 Years

Apache Airflow is undoubtedly the most popular open-source project for data engineering for years. It gains popularity at the right time with The Rise Of ...

DeepSeek SmallPond: A Game-Changer for Data Engineers Seeking Lightweight Solutions

DeepSeek SmallPond is here to shake up data engineering. See how this lightweight open-source framework offers a fresh alternative to Apache Spark and Flink for ...
Photo by Jongsun Lee on Unsplash

Apache Airflow 3.0 Is Coming Soon: Here’s What You Can Expect

Discover the upcoming features in Apache Airflow 3.0, with insights from the Airflow 3.0 workstream. Get ready for the next big release!
0 0 votes
Article Rating
Subscribe
Notify of
0 Comments
Oldest
Newest Most Voted
Inline Feedbacks
View all comments
Scroll to Top
0
Would love your thoughts, please comment.x
()
x