
Data Engineering
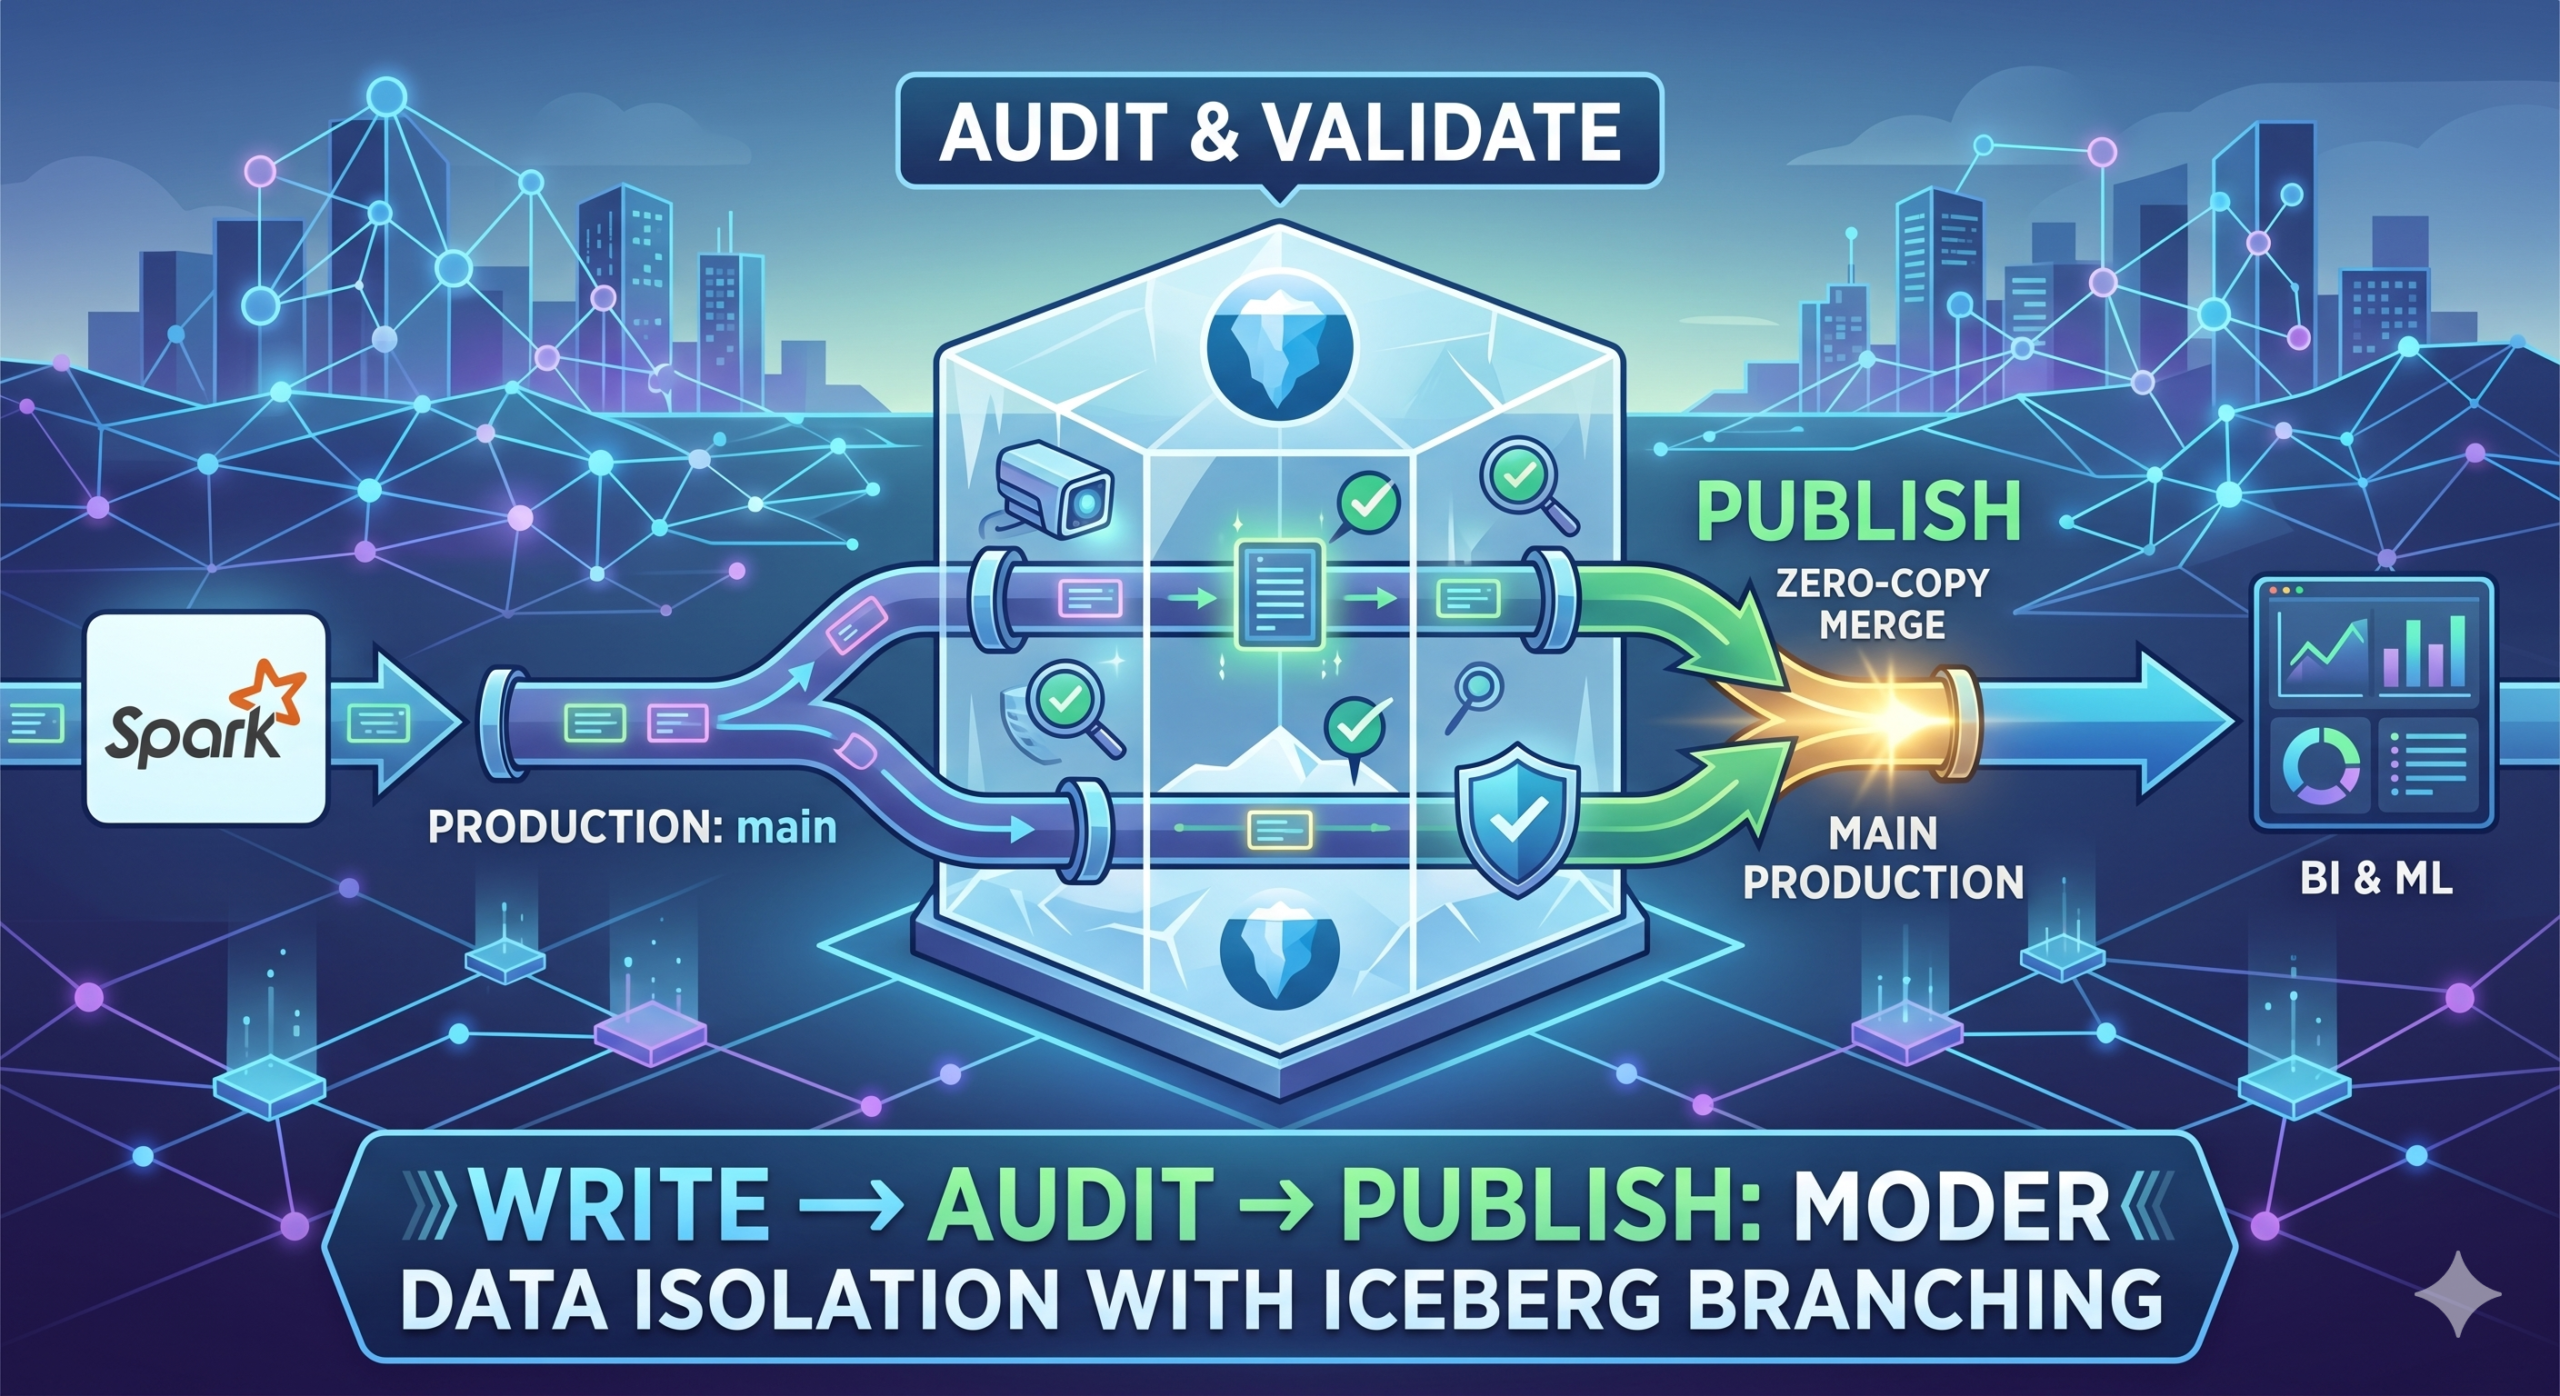
Stop Breaking Production Data Pipeline: Implementing Write-Audit-Publish (WAP) with Spark and Apache Iceberg
Learn how to implement the Write-Audit-Publish (WAP) pattern in your data pipelines using Apache Iceberg branching and PySpark to guarantee data quality.

Data Engineering
The Data Modeling Wars: Inmon vs. Kimball vs. Data Vault
Confused by data modeling? We break down the key differences between Inmon, Kimball, and Data Vault architectures so you can choose the right strategy for your data warehouse.
Blog
Apache Spark 4.1 is Here: The Next Chapter in Unified Analytics
Apache Spark 4.1 is here. Discover how Real-Time Mode (RTM), Declarative Pipelines, and Arrow-Native UDFs are transforming data engineering and PySpark performance
Data Engineering
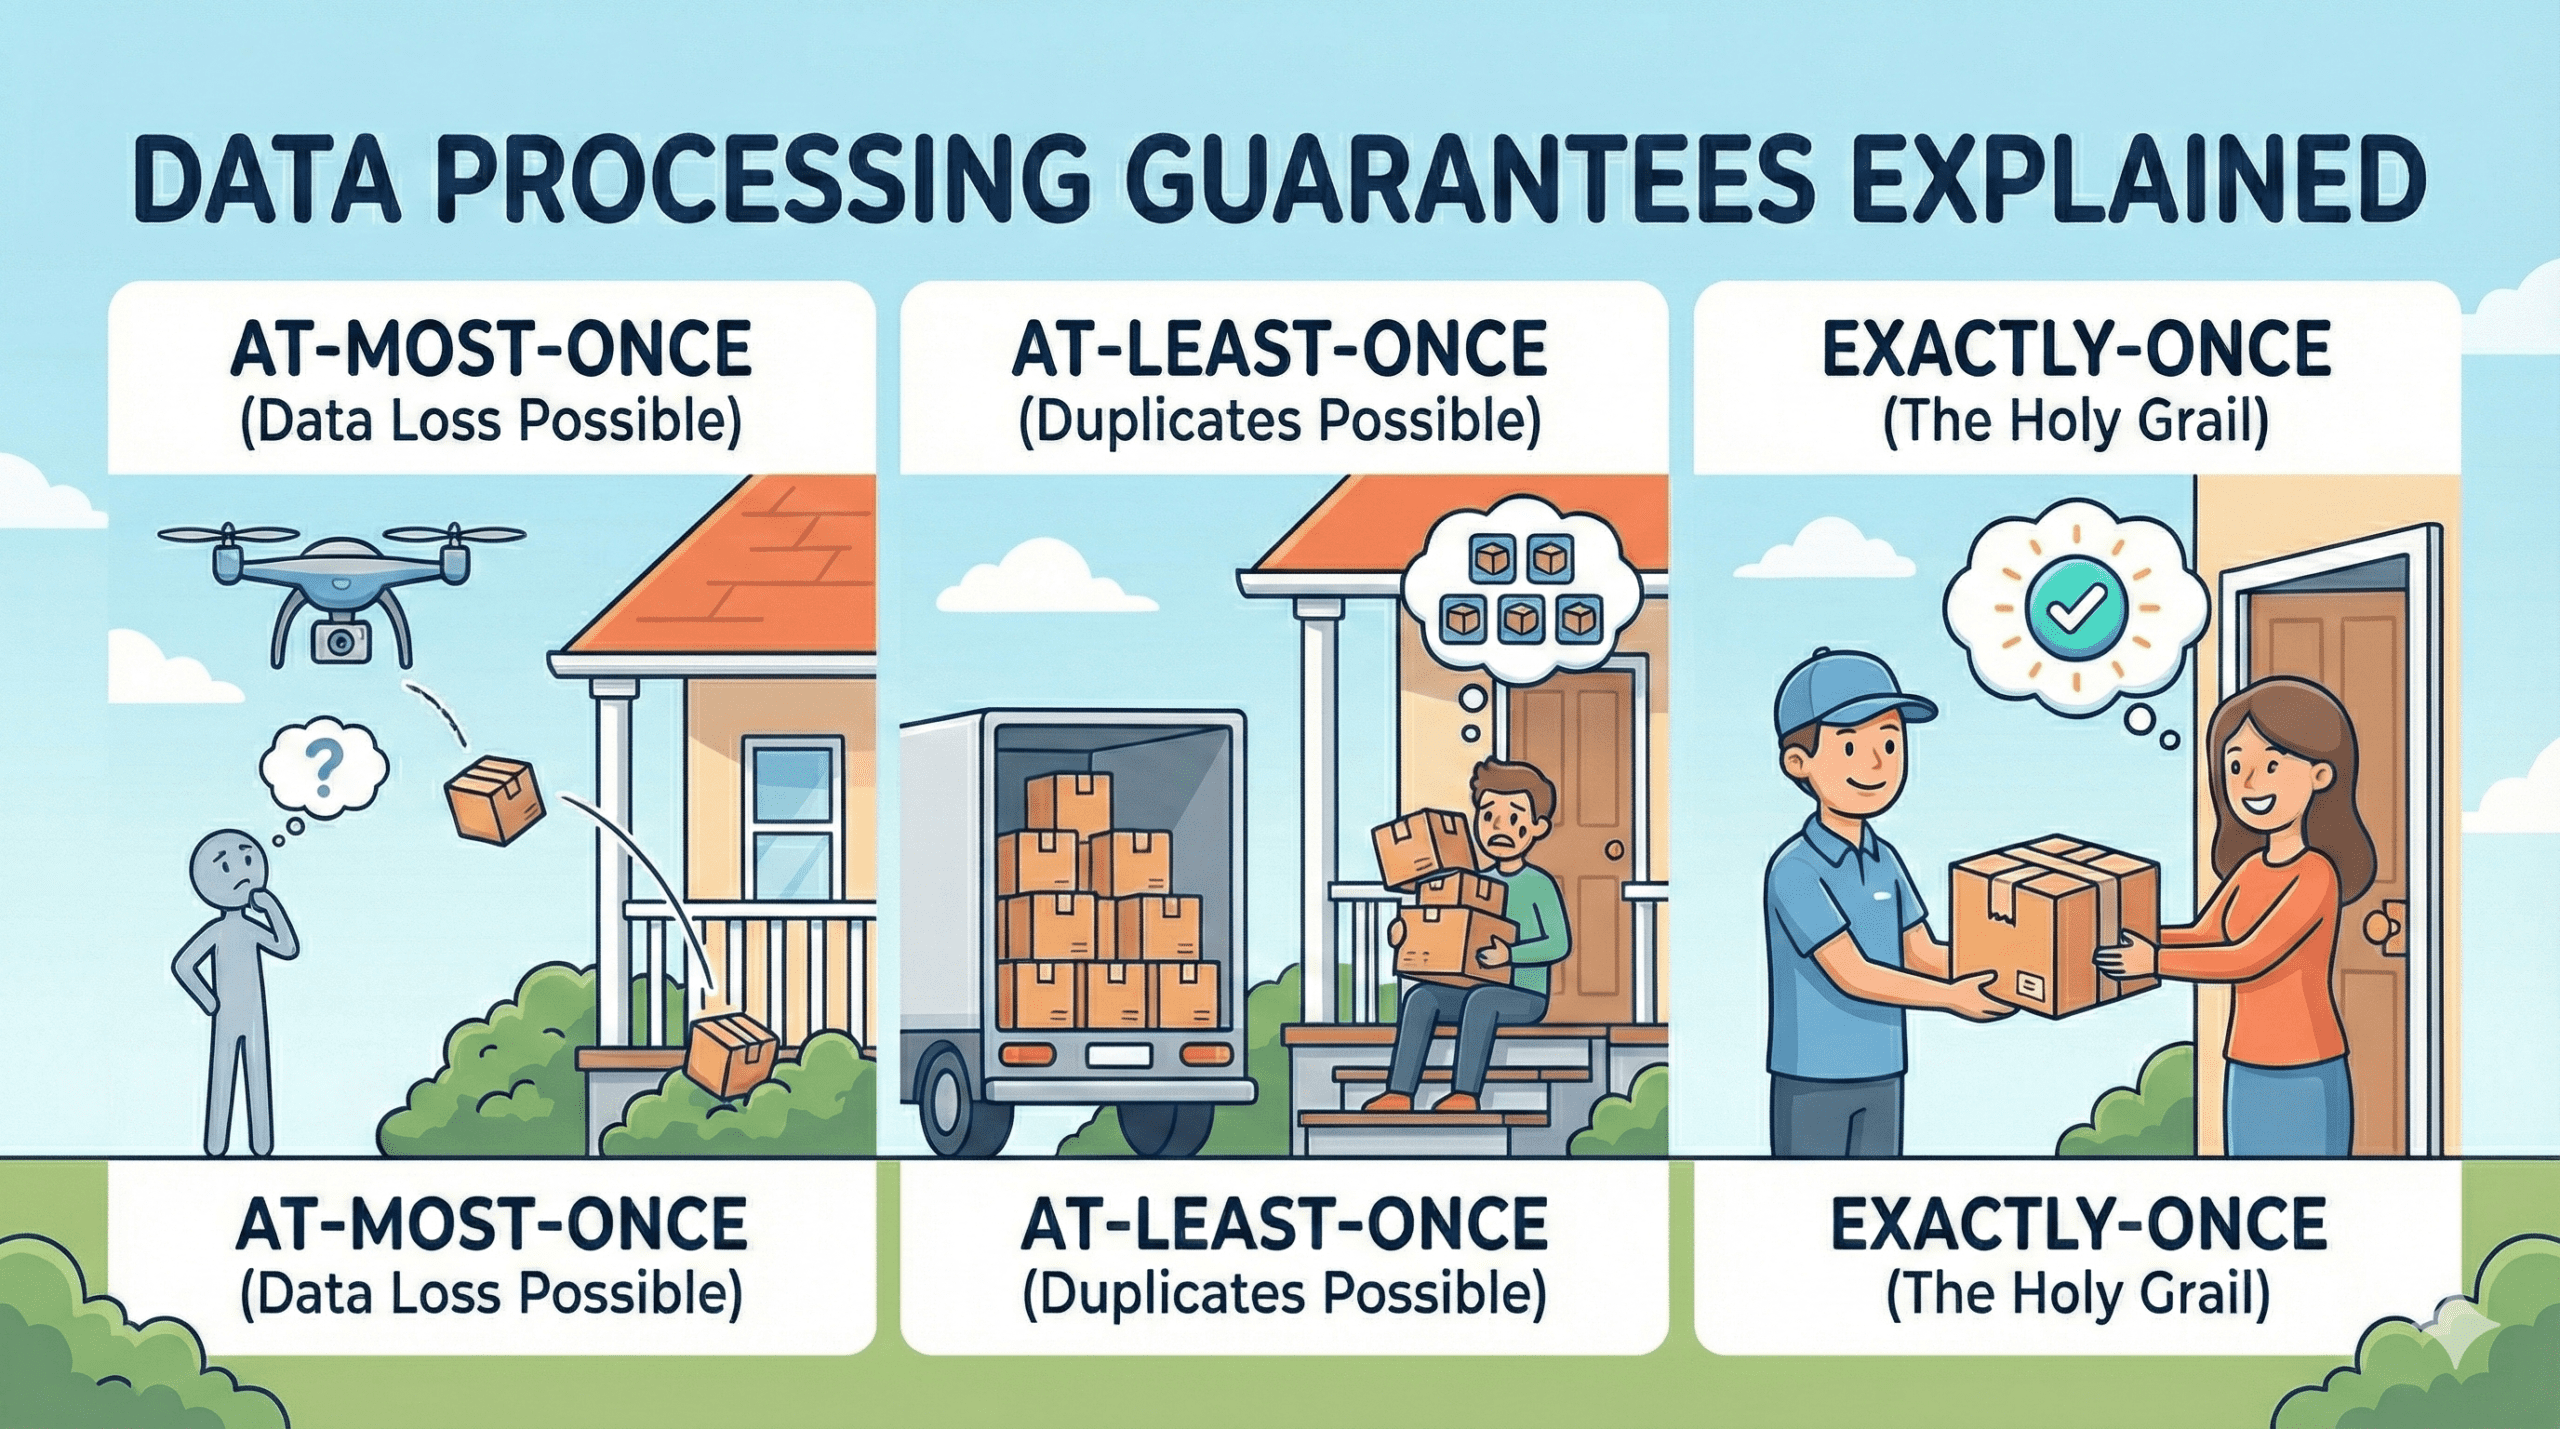
Data Processing Guarantees Explained: Exactly-Once, At-Least-Once, and At-Most-Once
Learn the difference between data processing guarantees (At-Most-Once, At-Least-Once, Exactly-Once) with simple real-world examples. Perfect for data engineering beginners

AI
2025 Retrospective: How AI Changed the Way I Engineer
2025 marked the shift from experimenting with AI to relying on it. In this retrospective, I explore how AI killed the 'tedious task' but failed the 'context test'—specifically sharing why OpenAI, Claude, and Gemini all couldn't fix a complex protoc dependency that still required a human engineer.

Data Engineering
The Ultimate Apache Spark Guide: Performance Tuning, PySpark Examples, and New 4.0 Features
The ultimate guide to Apache Spark. Learn performance tuning with PySpark examples, fix common issues like data skew, and explore new Spark 4.0 features.

Data Engineering
What Are Apache Flink Watermarks? A Beginner’s Guide to Handling Late Arrival Data
Struggling with late or out-of-order data? Learn how Apache Flink Watermarks work with event time to build accurate, reliable real-time stream processing systems.

Data Engineering
Data Engineering Heats Up in June 2025: A Look at the Latest Developments
Stay current with the essential data engineering news from June 2025. This monthly roundup covers the biggest announcements from Databricks' Data + AI Summit, new Snowflake features, Apache Flink updates, and the growing role of AI and Apache Iceberg in the data landscape.
AI
Automate Social Media Like a Pro (Almost Free): Using n8n + DeepSeek AI
Learn how to build a powerful, low-cost AI social media scheduler using n8n and DeepSeek. Automate content creation, shorten links, and schedule Twitter posts—without paying for Buffer, Hootsuite, or ChatGPT
AI
10 Best Books on Data Analytics with AI Agents – Read Before You Build!
Looking for the best books on data analytics and AI agents? Discover top-rated titles with summaries, user reviews, and expert recommendations for every data enthusiast and AI innovator.

Data Engineering
Don’t Get Tripped Up! 10 Common Data Engineering Pitfalls
Learn how to avoid 10 common data engineering pitfalls—like Spark data skew, Airflow retry chaos, schema drift, and more—with practical solutions
AI
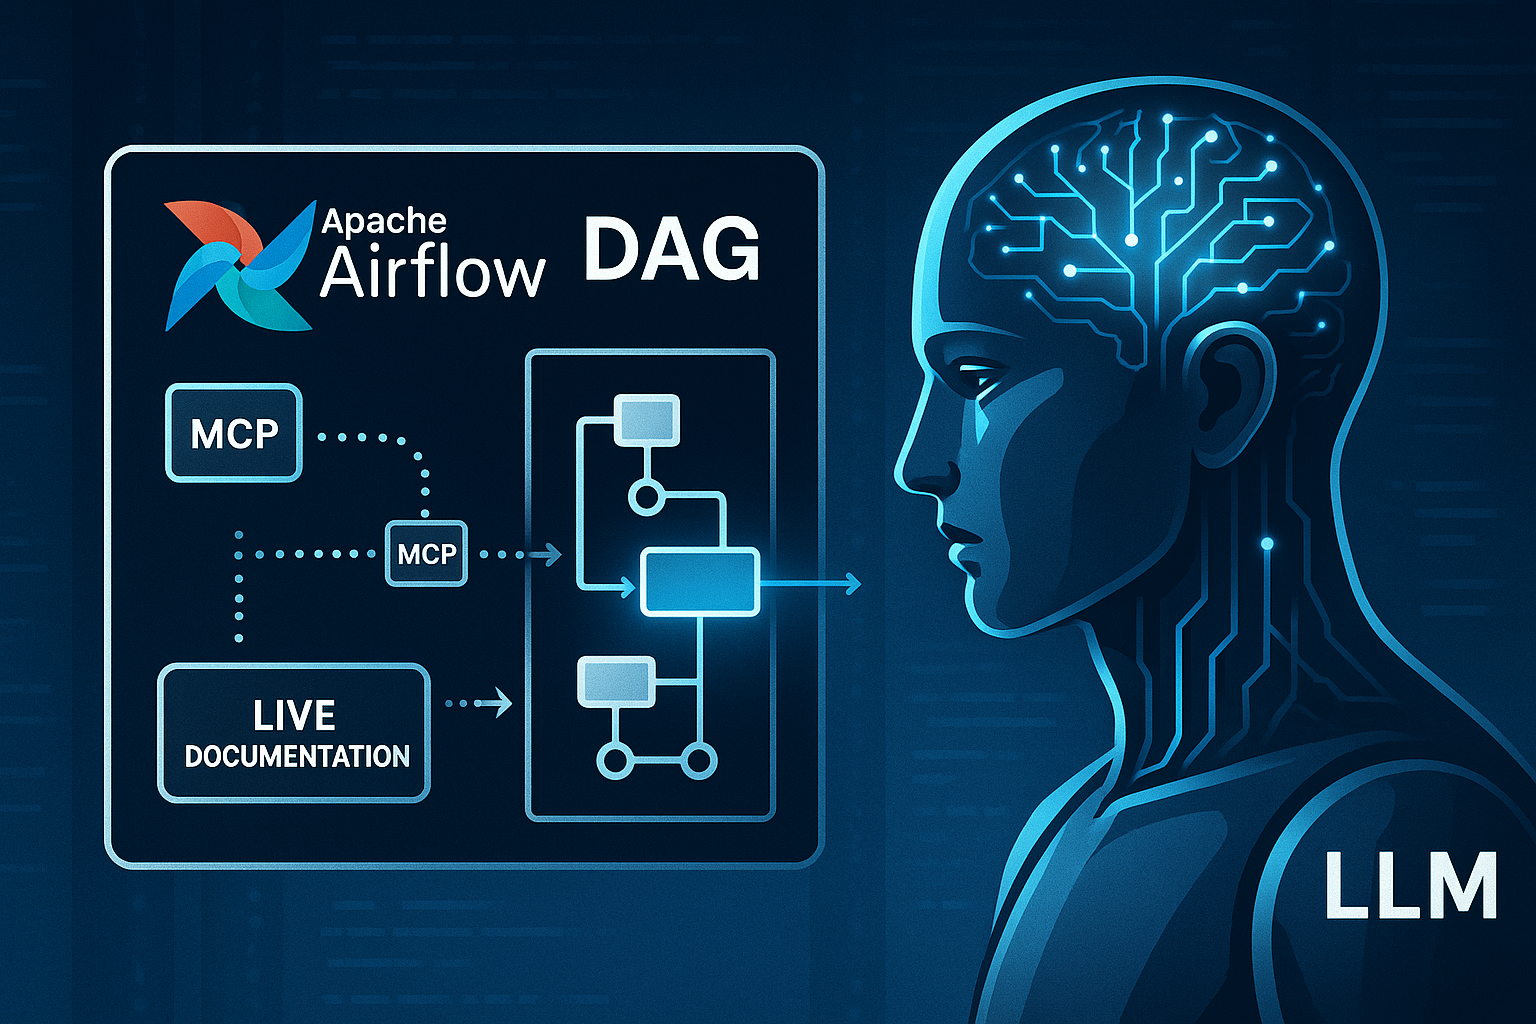
Beyond Basic Prompts: LLM + MCP Tackling Real-World Challenges—The Airflow 3.0 Auto-Update Example
Learn how LLM + MCP synergy revolutionizes complex tasks. An Apache Airflow 3.0 case study demonstrates auto-updating DAGs and overcoming AI limitations.