


Learn how to use, deploy, and maintain Apache Spark with this comprehensive guide, written by the creators of the open-source cluster-computing framework. With an emphasis on improvements and new features in Spark 2.0, authors Bill Chambers and Matei Zaharia break down Spark topics into distinct sections, each with unique goals.
Youâ ll explore the basic operations and common functions of Sparkâ s structured APIs, as well as Structured Streaming, a new high-level API for building end-to-end streaming applications. Developers and system administrators will learn the fundamentals of monitoring, tuning, and debugging Spark, and explore machine learning techniques and scenarios for employing MLlib, Sparkâ s scalable machine-learning library.
- Get a gentle overview of big data and Spark
- Learn about DataFrames, SQL, and Datasetsâ Sparkâ s core APIsâ through worked examples
- Dive into Sparkâ s low-level APIs, RDDs, and execution of SQL and DataFrames
- Understand how Spark runs on a cluster
- Debug, monitor, and tune Spark clusters and applications
- Learn the power of Structured Streaming, Sparkâ s stream-processing engine
- Learn how you can apply MLlib to a variety of problems, including classification or recommendation


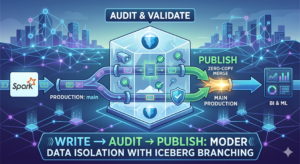
Stop Breaking Production Data Pipeline: Implementing Write-Audit-Publish (WAP) with Spark and Apache Iceberg
Learn how to implement the Write-Audit-Publish (WAP) pattern in your data pipelines using Apache Iceberg branching and PySpark to guarantee data quality.

The Data Modeling Wars: Inmon vs. Kimball vs. Data Vault
Confused by data modeling? We break down the key differences between Inmon, Kimball, and Data Vault architectures so you can choose the right strategy for your data warehouse.
Apache Spark 4.1 is Here: The Next Chapter in Unified Analytics
Apache Spark 4.1 is here. Discover how Real-Time Mode (RTM), Declarative Pipelines, and Arrow-Native UDFs are transforming data engineering and PySpark performance