


Data Engineering Heats Up in June 2025: A Look at the Latest Developments
Stay current with the essential data engineering news from June 2025. This monthly roundup covers the biggest announcements from Databricks’ Data + AI Summit, new Snowflake features, Apache Flink updates, and the growing role of AI and Apache Iceberg in the data landscape.
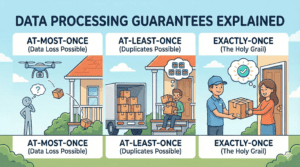
Data Processing Guarantees Explained: Exactly-Once, At-Least-Once, and At-Most-Once
Learn the difference between data processing guarantees (At-Most-Once, At-Least-Once, Exactly-Once) with simple real-world examples. Perfect for data engineering beginners

Boosting Spark Union Operator Performance: Optimization Tips for Improved Query Speed
We will focus on the Apache Spark Union Operator Performance with examples, show you the physical query plan, and share techniques for optimization in this story.