

How to Engage with Users By Storytelling: Show Data Analytics in R and Shiny
Using R and Shiny, we can build an app where the end users can interact with the data analysis we have done. I will show ...


Mar08
DeepSeek SmallPond: A Game-Changer for Data Engineers Seeking Lightweight Solutions
DeepSeek SmallPond is here to shake up data engineering. See how this lightweight open-source framework offers a fresh alternative to Apache Spark and Flink for ...
Jun15
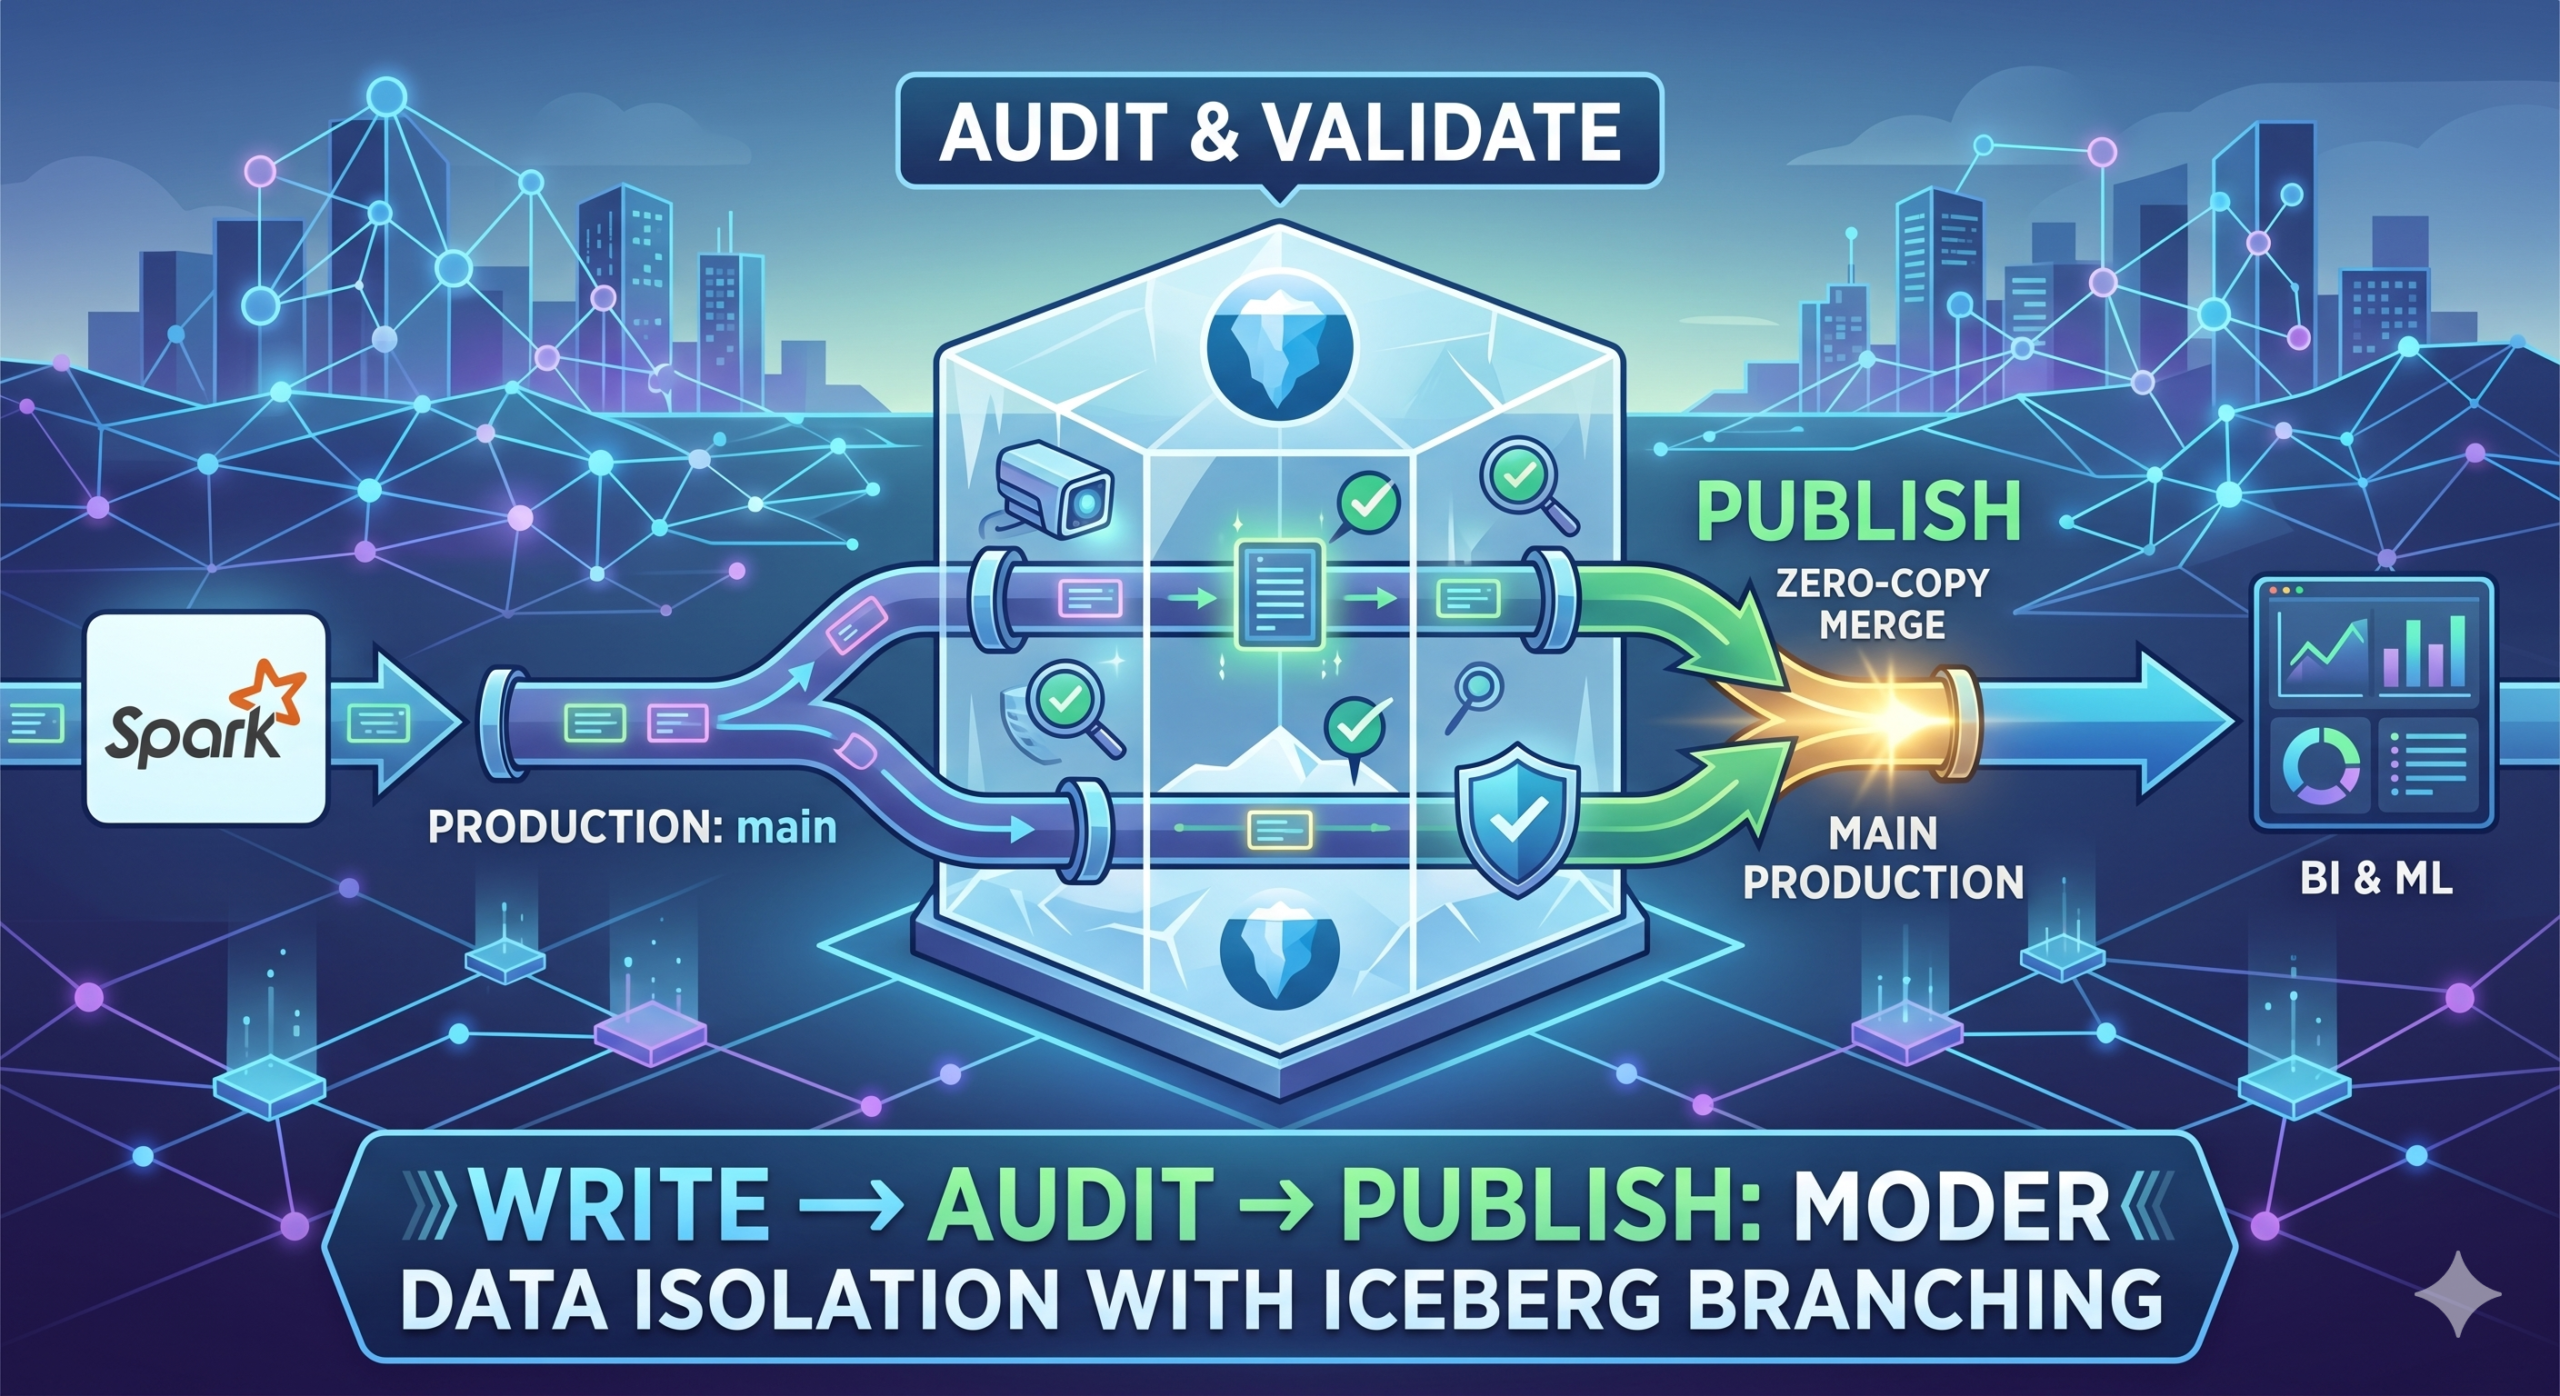
Stop Breaking Production Data Pipeline: Implementing Write-Audit-Publish (WAP) with Spark and Apache Iceberg
Learn how to implement the Write-Audit-Publish (WAP) pattern in your data pipelines using Apache Iceberg branching and PySpark to guarantee data quality.

Aug07
Visualizing Data with ggridges: Techniques to Eliminate Density Plot Overlaps in ggplot2
When it comes to visualizing data with a histogram and dealing with multiple groups, it can be quite challenging. I have recently come across a ...
I don’t consider myself a data engineer, but most of the work I do involves data engineering. And R really helps me do this. It’s good to finally come across a website that understands the power of R.